Ops Manager Extension: Line Follower Explained
| Site: | GoLabs |
| Course: | Robotic Challenges with Python and GoPiGo |
| Book: | Ops Manager Extension: Line Follower Explained |
| Printed by: | Guest user |
| Date: | Sunday, 7 December 2025, 5:49 AM |
Description

This is the fourth challenge within the Robotics with GoPiGo and Python Curriculum.
Your task is to design a robot program that increases the volume of products that Amazing.com can ship out to its customers on a daily basis without increasing the number of robot pickers it employs.
Learn how to program and calibrate the Line Follower while they try to design an efficient system.
1. As seen before, what is a line follower?
As a reminder, and before going any deeper, here's what you've learned so far about the line follower.
The line follower has a set of 6 line sensors on its underside, spread out equally across its length. Each of these sensors is capable of detecting whether or not it is immediately above a black line. Based on what these 6 sensors collectively tell us we can work out where the line is relative to the center of the line follower.

2. How does a line follower work?
Each of the 6 line sensors works by shining an infrared light down at the floor below and measuring the amount of light reflected back. The more infrared light that is reflected back, the higher the number that the sensor will read.
You can read the sensors with the following line of code:

3. Experiment
Different colors and materials reflect different amounts of infrared light. Let’s do some basic science experiments to understand this further.
In the experiments that follow you will use a template function called test_sensor_readings() that has been written for you. This reports summary statistics based on the values read from all the line sensors on the underside.
In preparation,
- amend the code in the Test & Calibration Code cell so that the test_sensor_readings() function (highlighted in red) is un-commented
- ensure everything else is commented out

Click on Run Selected Cell to check that everything is in working order. You should see a response like the one below (your numbers will be different):
AVERAGE = 0.07 MINIMUM = 0.03 MAXIMUM = 0.11
4. Experiment: Color
- Place the robot on top of a piece of white card.
- Run the Test & Calibration cell.
- Note down the average value reported in a table like the one shown below.
- Now repeat the exercise with a black piece of card.
- Compare the two readings.

5. Calibration step 1
Previously the line follower calibration was done with the help of the Sensor Control Panel. Let's do it differently so you can understand it fully.
Print off a straight line sheet from the free downloadable line follower template document.
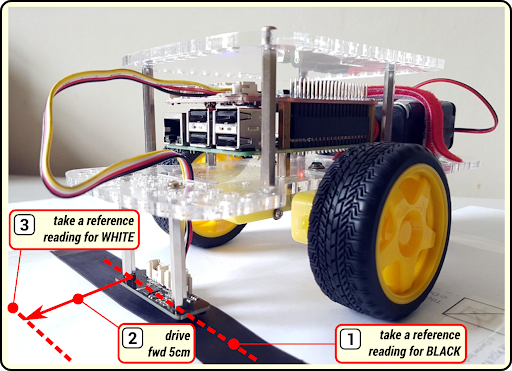
Place your robot on this sheet, facing sideways, with the line follower directly above the black line, as shown in the image below.

6. Calibration step 2
To help you calibrate your robot, you have access to a pre-written template function called calibrate().
- Amend the code in the Test & Calibration Code cell so that this function (highlighted in red) is un-commented and everything else is commented out.
- Click on Run Selected Cell.

The robot will:
- take a reference reading for black [1],
- drive forward 5cm [2]
- take a reference reading for white [3].
All being well, you should see the following summary statistics for black and white reported in the Notebook under the Test & Calibration cell (your numbers will be different):
BLACK: AVERAGE = 0.07 MINIMUM = 0.03 MAXIMUM = 0.11
WHITE: AVERAGE = 0.76 MINIMUM = 0.63 MAXIMUM = 0.86
A good average value reported for black is less than 0.25. If your reading is greater than this value, perhaps your print contrast is low. You can improve things by coloring in the black line on the sheet with a black marker, re-positioning the robot and re-running the above calibration process. Has the average black value dropped significantly?
A good average value reported for white is greater than 0.75. If your reading is less than this value, how can you improve the environment to help with proper line detection?
Investigate what can be done with the next steps.
7. Experiment: Lighting Conditions
Do you think the sensor’s readings can be affected by being in sunlight or shade. What about being in the dark?
Using white card, repeat the above experiment
- in direct sunlight (where possible)
- in a shaded area
- in the dark (or quasi-dark)
Use a blanket or newspaper draped over the robot to simulate darkness.
Record the average values reported in a table like the one below.

8. Experiment: Materials
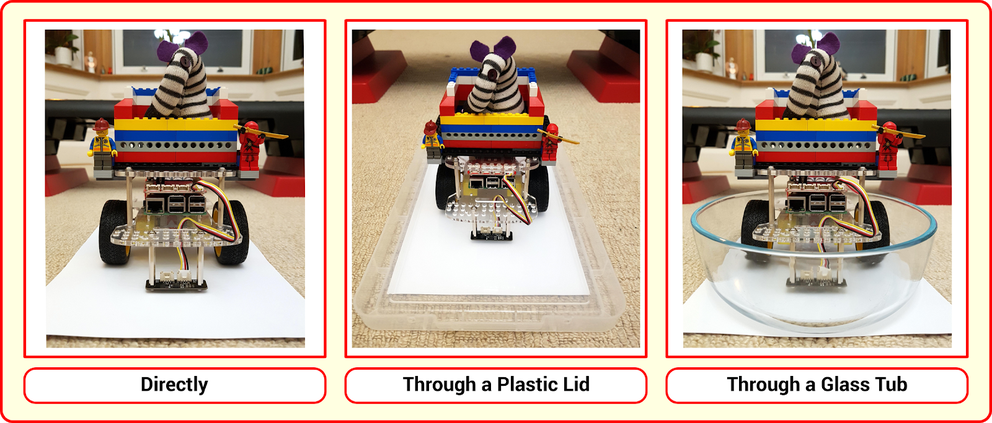
Visible light travels through materials such as glass or clear plastic. If it didn’t, we wouldn’t be able to see through windows. Let’s conduct an experiment to see if infrared light can travel through these materials as well.
In an area away from direct sunlight:
Experiment #1
- place the robot on top of white card
- run the Test & Calibration Code cell
- record the average value reported in the table below.
Experiment #2
- Now place a large glass oven dish on top of the white card
- place the robot inside it
- re-run the code and record the average value reported.
Experiment #3
- Repeat this experiment, replacing the oven dish with a sheet of clear plastic or the lid of a clear plastic storage crate.

9. Experiment: Foil Backing
This experiment can be useful if your pieces of white or black paper are thin.
- place the white card on a sheet of tin foil, shiny side up.
- place the robot on top of the card
- run the Test & Calibration Code cell
- record the average values reported in a table like the one below.
Repeat the exercise with black card.

10. Pro Tip
If you are doing this investigative work before attempting your main project, make sure you calibrate your robot one last time with the conditions that are representative of what your robot will encounter when running the main project.

11. Congratulations!
You have successfully completed the Ops Manager mission. Your warehouse is functioning at top speed and your clients are happy!
If you haven't done so yet, you can investigate what is a PD controller with Ops Manager Extension: PD Controller to get an even finer control over your robot. Commercial robots often use a PID controller, which is even more advanced.