Learn 4: Experiment With Color Sensing
| Site: | GoLabs |
| Course: | Robotic Challenges with Python and GoPiGo |
| Book: | Learn 4: Experiment With Color Sensing |
| Printed by: | Guest user |
| Date: | Wednesday, 24 June 2026, 12:18 AM |
Description

This is the fifth challenge within the Robotics with GoPiGo and Python Curriculum.
Your task is to design a robot program to deliver a selection of mail to the residents of GoPiGo Drive, a small cul-de-sac containing 3 houses.
Learn how to how to use and calibrate the color sensor.
1. How does a color sensor work?
The color sensor is new to us in this project so let’s take a brief look at how it works.
Our perception of color is due to the colors of light that different objects reflect and absorb. The color sensor works in exactly the same way. It shines a white light at an object or surface and records the amount of each color in the reflected light. It can also record the intensity of the reflection (the “clear” value).
2. Realtime Data Analysis
Wouldn’t it be cool if we could put ourselves in the color sensor’s place and see what it sees in real time? Well, you can! Let’s show you how to do just that by using a really cool feature of Jupyter - a live auto-updating graph.
In the button panel under the Interactive Control Code cell there are buttons labelled Start Data analysis and Stop Data Analysis. These start and stop a graph update function that we’ve written for you.
- Position your robot on the printed color sensor calibration sheet with the color sensor directly above a colored square.
- Click on Start Data Analysis.
- Every few seconds pick the robot up, place it down on another colored square.
You will see a graph like the one below appear above the button panel. This displays the most recent values read for each of red, green, blue and clear. We have highlighted interesting regions of the graph below for you.
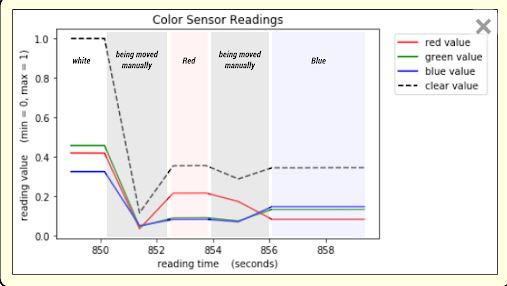
This graph automatically updates itself as new sensor readings are taken and stored in data list attributes in the variable container, with new values appearing on the right hand side as old values disappear off the left.
When dealing with large volumes of continually streaming data, it’s so much easier to monitor and interpret that data in real time this way than it would be by reading log messages being continuously printed in the notebook, isn’t it?
- Experiment with a range of different colors by coloring areas of white paper with pencils or colored markers and placing your robot’s sensor over these.
- How does each color relate to the mix of red, green, blue and clear sensor readings that you observe in the graph?
- How do the sensor readings compare?
When you have finished experimenting with color, click on the Stop Data Analysis button to halt the graph updates.
3. Calibrating the Line Sensor
- Print off a straight line sheet from the downloadable line follower template document.
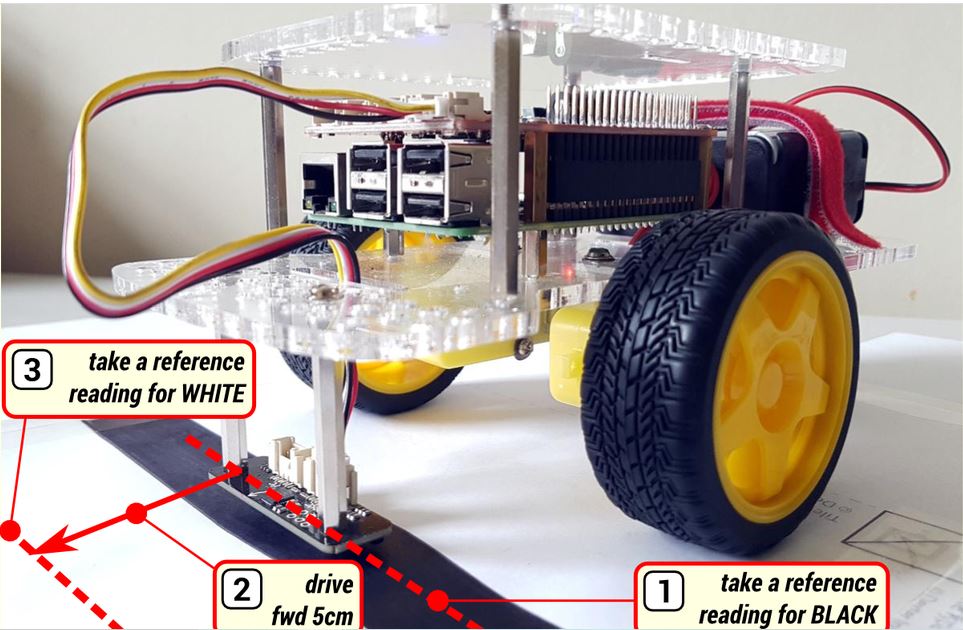
- Place your robot on this sheet with the line follower directly above the black line, as shown in the image below
- Click on the Calibrate Line Sensor button in the button panel below the Interactive Control Code cell.
The robot should :
- take a reference reading for black [1],
- drive forward 5cm [2] and then
- take a reference reading for white [3].
The following summary statistics for black and white should be reported in the Notebook under the button panel (your numbers will be different):
BLACK: AVERAGE = 0.07 MINIMUM = 0.03 MAXIMUM = 0.11
WHITE: AVERAGE = 0.76 MINIMUM = 0.63 MAXIMUM = 0.86
To test the accuracy of our line follower after calibration:
- place the robot over the black line as if it were following it,
- select Line Follower Sensor from the I2C-1 dropdown list in the sensor control panel.
- Observe the string of Ws and Bs as you move the robot from left to right.
Does this string accurately reflect the position of the line relative to the center of the sensor?
If you haven't done the Extension: Line Follower Explained in Mission 4, you could take a look now if you're curious about how this works.
4. Calibrating the Color Sensor
- Place the robot on top of the printed color calibration sheet with the color sensor above the red square, exactly as we did when we tested the sensor.
- Click on the Calibrate Color Sensor button.
We have told the robot the order of the color samples on that sheet. Armed with that knowledge it will calibrate its color sensor as follows:
- based on its sensor reading, light up its right eye the color that it thinks it has seen
- re-calibrate its settings for that color to match the sensor readings
- light up the left eye to confirm the color that it has just re-calibrated
- drive forward to the next color sample on the sheet and repeat 1-3 above
Once it has completed color calibration, the eyes will flash on and off.
What we are doing here is replacing the pre-defined default settings for each color with the red, green, blue and clear values read in the current environment.
After calibration has been completed, check the sensor accuracy by re-running the calibration. You should notice that the robot’s guesses (right eye color) will now match the confirmed color samples (left eye color).
5. Demo: First, Line Follower
Now that we’ve calibrated both sensors, let’s make our robot follow a line until it either loses that line or identifies a given color, then turn around and come back.
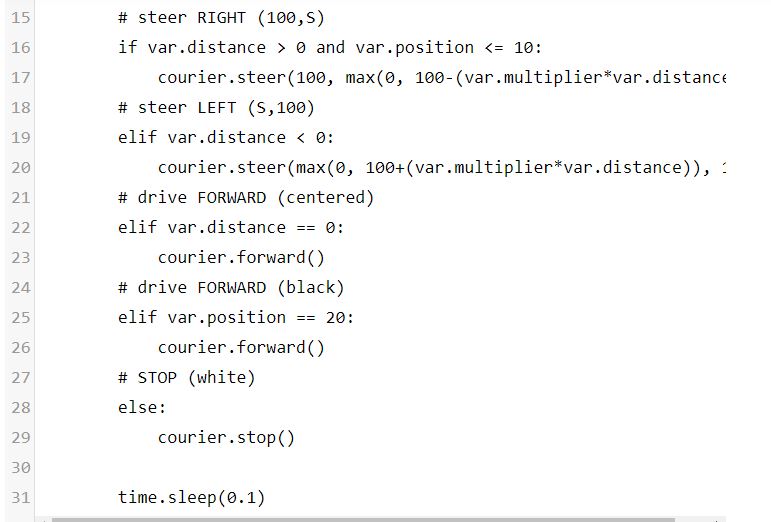
In the Main Code cell we have provided you with a copy of the basic proportional line following algorithm from the Robot Operations Manager mission, with the following minor changes made:
- The code has been placed inside a main() function.
- The init() function has been removed (it's now called in the Interactive Control Code cell).
- A global declaration for our variable container instance (var) has been added and the courier’s state has been reset using the reset() function that we wrote.
- References to picker have been replaced with courier.
- We’ve also added a stopping condition that is linked to the Emergency Stop button.

6. Demo: Now with Color Sensor
Now let’s add some code that:
- senses a green marker
- turns the robot around by 180 degrees so that it can return the way it came.
We’ve written some template functions that you can use here.
These functions:
- read the color sensor (read_color_sensor( )),
- record the values read in container attributes for use by the data analysis graph,
- light both of the courier’s eyes up to show the color just read (record_color( )).
Add these lines just above the time.sleep(0.1) line
read_color_sensor()
record_color('both')if var.color_name == ‘green’:
courier.turn_degrees(180)
7. References and Going Forward
Download and print the following two files as references.
You are now ready for the main project! Will your robot be able to deliver the packages without mistakes?