Instructions
| Site: | GoLabs |
| Course: | Planetary Rover |
| Book: | Instructions |
| Printed by: | Guest user |
| Date: | Thursday, 2 July 2026, 7:31 AM |
Description
Students will describe properties of planets in the Habitable Zone. Students will analyze data about the temperature of planets in our solar system. Students will investigate the temperature of a new planet and compare the temperature readings to that of other planets in our solar system to decide if it is located in a habitable zone.
1. Goldilocks and the Three Bears
Read the excerpt below from Goldilocks and the Three Bears.
Once upon a time, there was a little girl named Goldilocks. She went for a walk in the forest. Pretty soon, she came upon a house. She knocked and, when no one answered, she walked right in.At the table in the kitchen, there were three bowls of porridge. Goldilocks was hungry. She tasted the porridge from the first bowl."This porridge is too hot!" she exclaimed. So, she tasted the porridge from the second bowl."This porridge is too cold," she said. So, she tasted the last bowl of porridge."Ahhh, this porridge is just right," she said happily and she ate it all up.
(From Goldilocks and the Three Bears, http://www.dltk-teach.com/rhymes/goldilocks_story.htm)
Scientists are searching for a planet that is not too hot and not too cold so that it can sustain human life. There are also other factors other than temperature that scientists are investigating to determine if a planet can sustain human life.
What are some of the other factors scientists may investigate to determine if a planet can sustain human life?
2. Habitability
Investigate the Trappist 1 solar system.
- Click on the solar system view.
- Then, click on the check box to turn the habitable zone view on and off.
What do you notice about the habitable zone? Where are these planets located?
3. Temperatures in Our Solar System
Examine the chart below of the average mean temperature (°C) of each planet in our solar system.
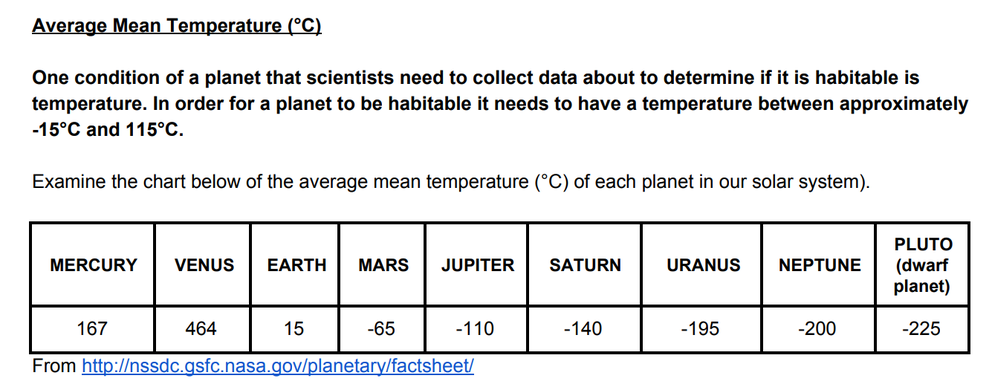
Generally, what happens to the average mean temperature of the planet as the distance from the sun increases? Why do you think that occurs?
What other factors could contribute to the average mean temperature of a planet?
Which data point is an outlier? (An outlier is a data point that is much bigger or smaller than most of the other data points in a set). Why? What do you think accounts for this difference?
4. Desired Temperature Range
Examine the graph of Seasonal Temperature Ranges at Gale Crater on Mars.
Here's a video that compares temperature ranges in Los Angeles to those at Gale Crater.
What do you notice? What impact(s) could the seasonal temperature ranges on Mars have on human life?
With your team, brainstorm temperature ranges that can sustain life.
5. Test Out Your Temperature Sensor
Attach temperature/humidity/pressure sensor and the distance sensor to your GoPiGo rover. Plug the sensors into the I2C ports and connect to your GoPiGo rover. Then, click on the Code in Bloxter button.
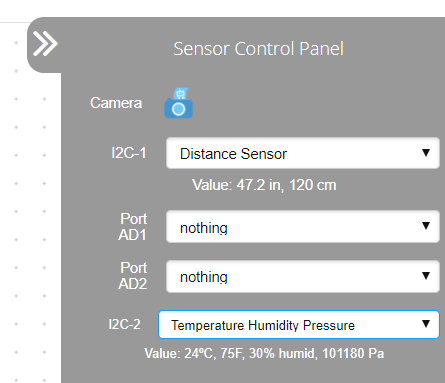
Using the drop-down menus on the Sensor Control Panel, select the temperature/humidity/pressure sensor for either I2C port.
Look at the live sensor readings for the temperature sensor.
- Temperature/Humidity/Pressure Sensor:
- Hold the sensor in your hands to warm it up or blow on it.
- Did the temperature increase?
- When you blow air onto the sensor, do the humidity levels increase as well?
6. Print Data
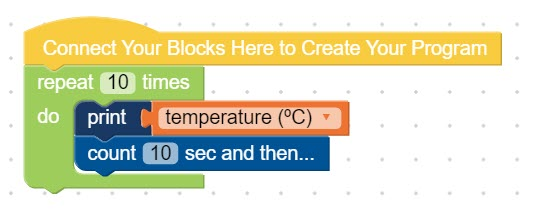
Instead of watching the live sensor readings, you can program the GoPiGo to write (print) a list of the data.
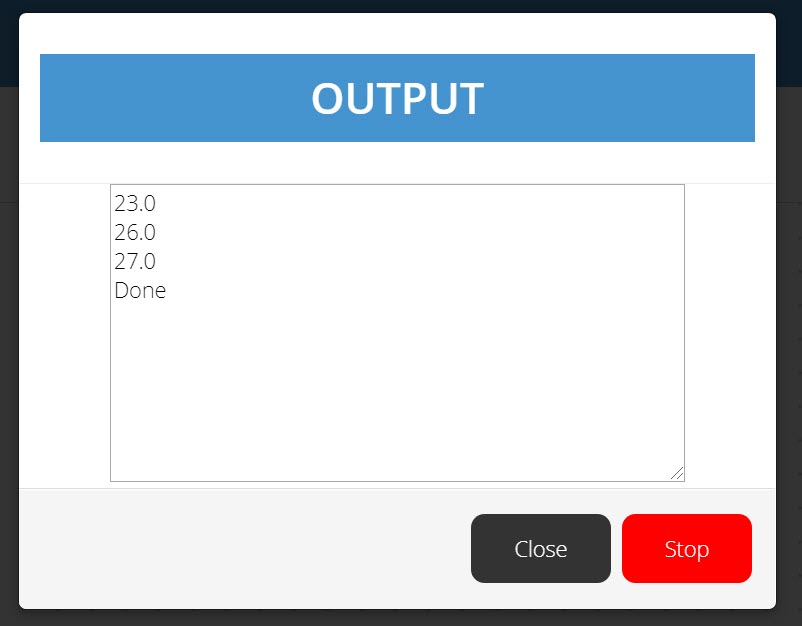
Recreate the program below. Click "Run Program". When you run the program, an output box will appear on the screen with your data.
Note: When you close the output box, the data is not saved. If you want to keep the data you will need to copy and paste it into another document.
7. Next Steps
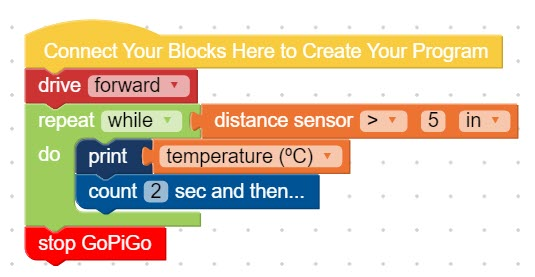
Test out different iterations of the program to learn more about using the print function to display data. A few ideas are shown below.
In the next lesson, you will create a program to log (collect) data about the temperature on the planet to see if it falls within the habitable zone.