12 Mission Instructions
| Site: | GoLabs |
| Course: | GoBox |
| Book: | 12 Mission Instructions |
| Printed by: | Guest user |
| Date: | Saturday, 25 July 2026, 9:02 PM |
Description
Your mission is to create a robotic seismograph that can travel to remote locations and measure tiny tremors. First, you will invent a way to simulate earthquakes so you can test your robot safely. Then you will design, test, and refine your robot until it is gathering the most useful data for you.
1. Problem
Earthquakes have puzzled humans throughout history. Scientists have worked hard to try to understand earthquakes so we can plan our cities in safer places, build stronger buildings, and prepare better when one is coming.
In order to study earthquakes, scientists use devices called seismographs to detect the motion of the Earth. A sensitive seismograph can record earthquakes so tiny that humans don’t even feel the motion. By recording many of these tiny tremors over time, scientists can try to understand when and why earthquakes occur and begin to make predictions about future earthquakes.
The first known seismographs come from China and date all the way to the first century. They didn’t use any electronics but were surprisingly efficient.
In this mission, you are a scientist developing a robotic seismograph that can travel to remote locations and measure tiny tremors. First, you will invent a way to simulate earthquakes so you can test your robot safely. Then you will design, test, and refine your robot until it is gathering the most useful data for you.
2. Design Your Shake Table
Your first design challenge in this mission is to decide how you will simulate earthquakes. Scientists simulate earthquakes all the time - to look at how different types of buildings will stand up to earthquakes, to test and calibrate earthquake detection equipment, and for other scientific studies.

The simplest type of earthquake simulator is an earthquake shaking table, or shake table. These tables provide a surface that can move in all directions. For this project, find a surface that you can easily shake back and forth (a small end table, for example), or you can build a real shake table that will more closely replicate an earthquake. Check out this resource about building your shake table.
Sketch a plan for your shake table on a piece of paper.
3. Build Your Shake Table and Prep Your Robot
Set up your shake table, as you planned. Try it out - can your earthquake knock down a block building or house of cards?
Then, remove any extra sensors, outputs and attachments from your GoPiGo and attach your IMU sensor to the A1 or A2 port (GoPiGo3). Use zip ties or other means to keep your cords nice and neat.
Before you turn on your robot, plug in a USB drive in one of the four USB ports - you’ll need it for this mission.
4. Getting Started
Just like you’ve become an expert at installing sensors, you probably have a pretty good idea of how to use them as well.
As usual, turn on your GoPiGo and connect to its Wi-Fi. Then type mygopigo.com into your browser. The first thing we are going to do is to test out our IMU sensor. If you need help, check out the IMU tutorial in the Learn in Bloxter section of DexterOS. Since we will also be using variables and lists, you need to go to Advanced Bloxter.
Now, use the dropdown on the Sensor Control Panel to select the IMU sensor in the port it is plugged into AD1 or AD2 for the GoPiGo3.
The IMU sensor opens up a whole world of possible data to collect.
- It can detect North, South, East, and West (compass).
- It can detect if it is speeding up or slowing down (acceleration),
- whether it is upright or upside down (gyroscope), and
- whether it is rocking from side to side (airplane).
At any time you want, you can see if your shake table is moving by looking at the Sensor Control Panel!

5. Code: Outline Your Goals
For this mission, you want to set your robot on your shake table and have it continuously checking for tremors, keeping track of the sensor readings over time. The IMU gives you lots of choices about how exactly you do that.
This is your twelfth GoBox mission, so you already know how to write a lot of different types of programs. What do you want your earthquake robot to detect? Our example code will use the IMU (accelerometer) but you might choose something different. That's ok!
You may remember creating your first list in Mission 8. As a reminder, a list is like a variable, but we can store more than one piece of data in it. Just like your shopping list, we can keep adding entries to our list, and we can go back and look at all the items on our list as well. If you would like to build your program to use the list function, you may do so, but we’ve got another idea.
For this GoBox Mission, we'll take lists to a whole new level by using the log function instead. Logging allows you to download a file with all the data from your robot so you can analyze it, graph it, and look for patterns yourself!
[BONUS: once you start to see some patterns, you can eventually teach your robot or your spreadsheet software to find the patterns for you. That's a version of programming too!]
Just like when we made our lists, you’ll need to set a variable for your robot to log.
Our example program will gather data from the IMU (accelerometer) in the Z-axis, but you can choose either X, Y, or Z. Don't worry too much about what all these different axes are. If your IMU is facing forward and pointing up like in our picture, then:
- X- axis will measure side-to-side wobbling
- Y- axis will measure forward-and-backward tilting, and
- Z-axis will measure up-and-down bouncing.
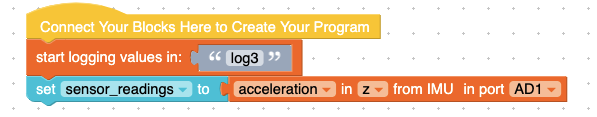
6. Code: Logging
To log information, you’ll notice that we first named the file that will get downloaded onto our USB drive. We chose “log3” for our example, but you might name it “Earthquake1”. Definitely include a 1 at the end of your number, because every time you run your program, it will download a new file onto your USB drive, so we’ll change the name between every test. “Earthquake1”, “Earthquake2”, “Earthquake3”, etc.
(The pictures we’re sharing are from our third attempt at solving this challenge - and I’ll let you in on a little secret. It took us more than three tries, but sometimes we forgot to update the name of our file in between tests! We’re all human!)
Let’s remember some of the basics we’ve learned over the past year:
- Computers only do exactly what you tell them to do.
- Computers can do lots of steps very quickly.
- Computers can gather more information that what we, as humans, can reasonably process.
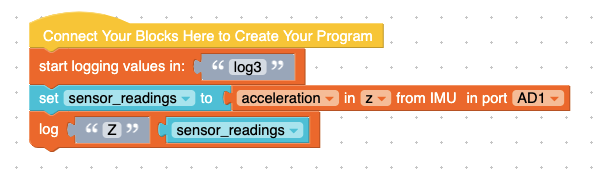
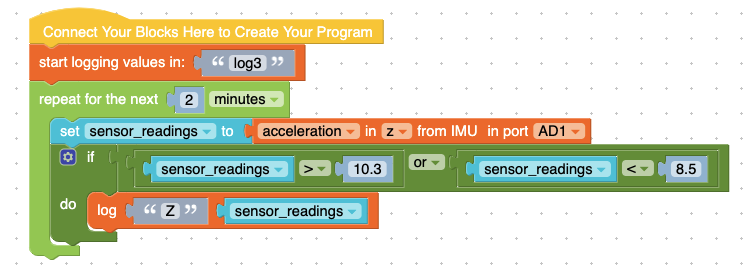
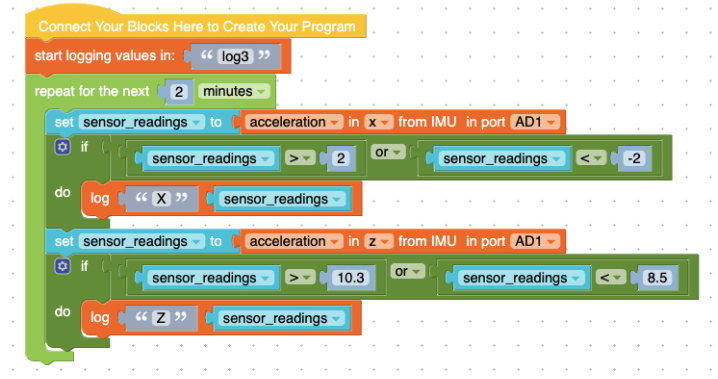
SO - if we just add the command for the robot to Log “Z” in “sensor readings” (image 1), it will only do that one time, right at the beginning, and never do it again. That probably won’t be the most useful earthquake detector.
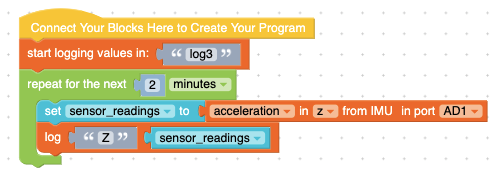
You probably already guessed it, we’ll need to add in a loop. For our example code, we chose a time loop and randomly chose 2 minutes as our testing duration.
7. Code: Choosing What's Important
I don’t know about you, but just having the loop gave us waaaaay too many numbers to notice any patterns very easily. We are hoping for a robot that can alert us to when an earthquake is happening, not to live-stream even when the shake table is standing still. Time to add a conditional statement!
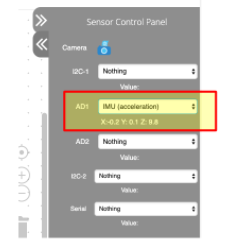
First, let’s take a look at the Sensor Control Panel while our robot is sitting still. What do you notice?
If you’re writing your code to measure the Z-axis like our example, then you might notice that a robot sitting totally still does not show a zero in the Z-axis! This is because gravity is always pulling everything towards the center of the Earth (or, in our case, the ground). Gravity is a constant, and any accelerometer standing still on a flat surface will notice gravity tugging on it at a rate of 9.8 (m/s² is the unit, but don’t worry about that today).
THIS MEANS that the number that will trigger our earthquake detector needs to be designed around 9.8 instead of around 0! Run your looping program one time without any conditional statements. Look for what the highest values are, and look for what the lowest values are. What do you notice?
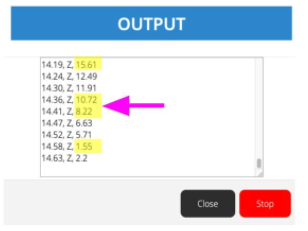
We noticed values as high as 15, and as low as 1.5 when our shake table was moving the most, but those were very extreme earthquakes.
Let’s start with a pretty narrow range for what’s considered “not an earthquake”. I certainly don’t like it when I notice the ground moving in any amount, but maybe I’m just picky.
You can choose how sensitive your robot is by adjusting the lower and higher values within your conditional statement. Feel free to start with our samples, but you can change them at any time!
8. Data: What Are You Going To Do About It?
The program we’ve designed so far sets you up for a whole series of choices you can make. This robot is supposed to detect earthquakes and let you know. Here’s a great place to choose what exactly you want to know and how you want to be informed!
One option is to focus on designing a robot that alerts you when during an earthquake. Feel free to use any of your previous learning about lights, blinkers, wheels, or other actuators to make your robot come to life during an earthquake. Since we’ve introduced you to lots of actuators like lights and buzzers and wheels, if you want to do this option, we’ll leave you to invent your own robot responses!
The other option, however, is to collect the data and analyze it like a scientist. Since this is new information, we’ll keep going alongside you step-by-step.
The logging function is technically collecting the values from your shake table and saving them to your USB drive. The name of the file will be whatever you typed in the first orange block (our example is “log3”).
Try updating the name of your file (maybe to “log4”) and running your shake table for thirty seconds or so. Once you have included a few different sizes of earthquakes in between moments of non-earthquake stillness, turn off your GoPiGo and plug your USB drive into your computer.
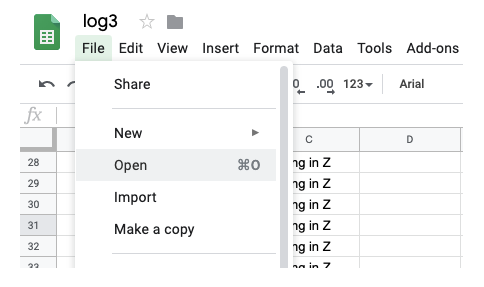
There are many programs that can open this file: the most commonly-known is Microsoft Excel, but if you don’t have that exact program, you can also use GoogleSheets which is a free web-based spreadsheet editor. Simply log into your account or create one, if you don’t already have one.
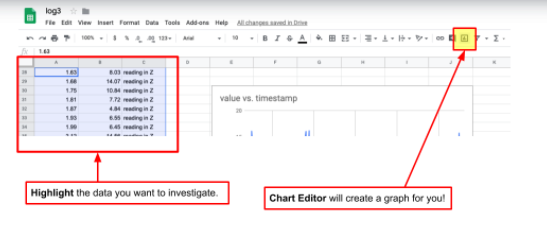
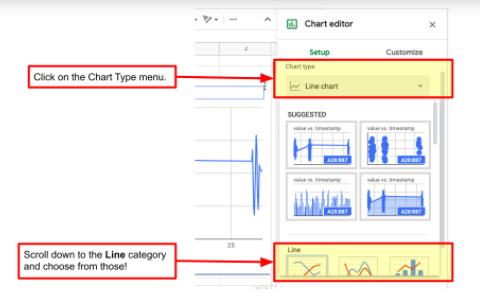
Then you can open the file (ours was called “log3.csv”) and start analyzing the data! One of the quickest ways to look for patterns is to have GoogleSheets graph your table for you. Simply highlight all the data cells and then click on the graphing button and choose line graph.
9. Test
Now you can play the same way real scientists do. Are there sections of your data that appear messy in the graph? Are there long stretches of boring, non-earthquakes? You might need to modify your GoPiGo program to be more or less sensitive, or you might want to try measuring the movement on different axes!
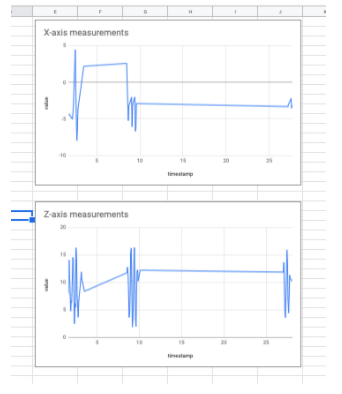
Here’s an example of our program when we wanted to compare the data from the Z-axis and the X-axis. And in the next image, you can see the side-by-side graphs that came from that data! Which one shows you most clearly when an earthquake is happening?
10. Iterate
Now that you have a working seismograph, what will you do next? Will you modify your shake table to create a more realistic earthquake? Or will you change your program to record data more or less often? Do you want your program to keep track of how many times motion was (or was not detected)?
Can you use this robot in other situations, like detecting when someone is opening a drawer in your room?
Follow the same steps – Design, Build, Code, Test – for each change you want to make. Make sure you keep track of your work.