12 Mission Instructions
9. Test
Now you can play the same way real scientists do. Are there sections of your data that appear messy in the graph? Are there long stretches of boring, non-earthquakes? You might need to modify your GoPiGo program to be more or less sensitive, or you might want to try measuring the movement on different axes!
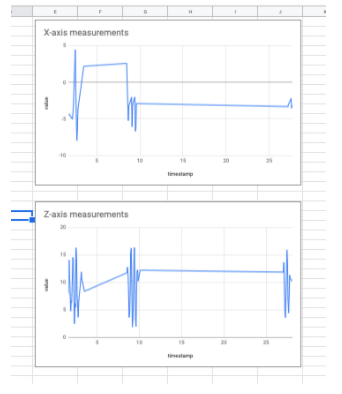
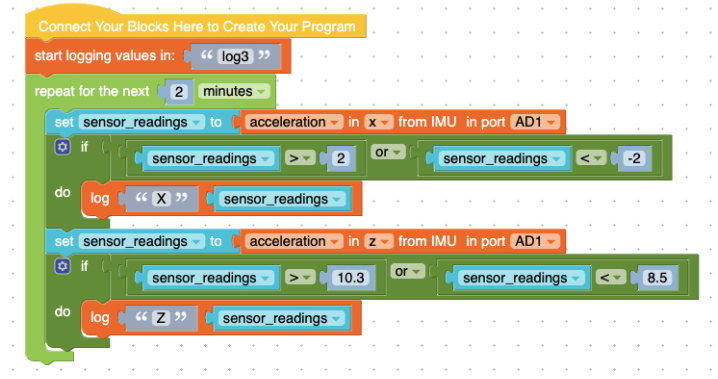
Here’s an example of our program when we wanted to compare the data from the Z-axis and the X-axis. And in the next image, you can see the side-by-side graphs that came from that data! Which one shows you most clearly when an earthquake is happening?