PA Designer Learn 3: Data Analysis
| Site: | GoLabs |
| Course: | Robotic Challenges with Python and GoPiGo |
| Book: | PA Designer Learn 3: Data Analysis |
| Printed by: | Guest user |
| Date: | Monday, 6 July 2026, 5:19 PM |
Description

This is the second challenge within the Robotics with GoPiGo and Python Curriculum.
Your task is to program your robot to alert a person with a hearing impairment to visiting house guests.
Learn how to use the Loudness Sensor alongside Jupyter Notebooks.
1. Capturing Data
Wouldn’t it be great if you could visualize what our loudness sensor is hearing? You can do that by plotting loudness values over time in a graph.
In the Variable Initialization cell, let’s declare two new variables called values and times and initialize them with empty lists. You will use these lists to store loudness values collected over time and record the times that these values were read.
Let’s also declare and initialize a smoothed_values list. You will use this for storing loudness values that you have “cleaned up”. More on that below.
Variable Initialization cell:
def init():
    # declare global variables that will be used by our program
    global start_time
    global values             # <= NEW
    global smoothed_values    # <= NEW
    global times              # <= NEW
    # perform a time-check at the start of our program
    start_time = time.time()
    # empty raw sensor values array (y axis data)
    values = list()           # <= NEW
    # empty smoothed sensor values array (y axis data)
    smoothed_values = list()  # <= NEW
    # empty sampling times array (x axis data)
    times = list()            # <= NEW
In the Main Code cell, instead of printing the loudness values let’s change our code to add them to the end of the values list. At the same time, let’s take a reading of the elapsed time and add that on to the end of the times list.
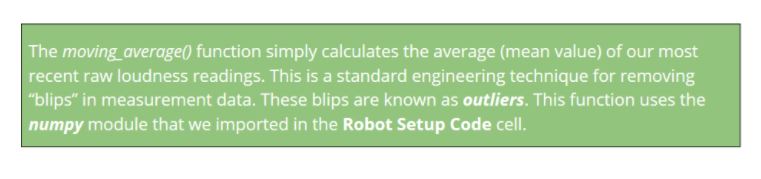
The loudness sensor is sensitive to changes in the environment. A pre-written function called moving_average() helps to reduce the effects of its sensitivity. You can find what this function does in the second Template Function cell. moving_average() uses the numpy library imported at the top.
Let’s call moving_average(), passing in our values list and add the result to the end of our smoothed_values list. You will use a list function called append() to add values to the end of a list.
Main Code cell:
# perform all variable declaration and initialization
init()

# repeat the following instructions for 10 seconds
while elapsed_time() < 10:
    # read loudness value and add it to end of the values list
    values.append(loudness.read())
    # add cleaned up value to the end of our “clean” data list
    smoothed_values.append(moving_average(values))
    # perform a time check and add elapsed time to end of the times list
    times.append(elapsed_time())
time.sleep(0.02)
2. Plotting Data
Let’s now plot the data you have collected in a couple of graphs:
- one to display raw data.
- one to display smoothed data.
In the Data Analysis cell, call the plot_values() function, passing it a string that describes what our data is and the values and times lists that we populated in the Main Code cell.
plot_values() is a template function written for you which generates a graph given two lists of data representing values on the graph’s X and Y axes. It uses the matplotlib module imported in the Robot Setup Code cell.
Do the same using smoothed_values as our Y axis data instead of values.
# generate a graph to visualize the raw loudness data
plot_values("loudness", times, values)
plot_values(“smoothed loudness", times, smoothed_values)
3. Running Data Analysis
- Select the Main Code cell
- Click on Run Selected Cell
This re-initializes all the variables and collects 10 seconds of loudness data.
- Select the Data Analysis cell
- Click on Run Selected Cell again.
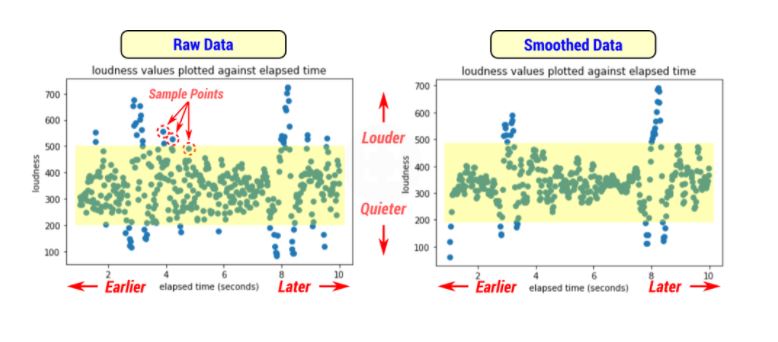
You should see two graphs like the ones displayed below. Each dot in these graphs is a point in time measurement of loudness. In the engineering world, we call these measurements sample points.
Most of the sample points in our example graphs have loudness values that lie within a horizontal band. This is the ambient noise of your environment. For a noise to be identifiable above ambient noise, it must generate loudness values higher than this.
4. Troubleshooting
If you get an error stating :
NameError: name ‘moving_average’ is not defined
this is telling you that you haven’t yet run the cell where the moving_average function is defined. To fix this error, select the moving_average cell and click on Run Selected Cell before retrying.
The same principle applies for the plot_values function.
5. Experiment
Different Environments
Re-run the Main Code cell followed by the Data Analysis cell in a number of different environments (noisy, quiet, inside, outside). How does this affect the height and the spread of the sample points on your graph?
Different Noises
Ring a selection of different bells while running your code. Can you spot where you rang each of the bells in the resulting graphs? Which bell gives the highest loudness readings? Which bell do you think will be most recognisable in the widest range of environments?
6. Next Step
Good job, almost done with the Learn section!
You are now ready to move on to PA Designer Learn 4: More Python Commands.
Or you may want to go back to the Personal Designer Assistant main page.