PA Designer Learn 4: More Python Commands

This is the second challenge within the Robotics with GoPiGo and Python Curriculum.
Your task is to program your robot to alert a person with a hearing impairment to visiting house guests.
Learn how to use the Loudness Sensor alongside Jupyter Notebooks.
5. Reading List Values
What if we want to examine or use some of the values stored in our lists?
We might want to do this if we need to know about the most recent value that we have added to it. We can access values in a list by referring to their position (or index) in the list.
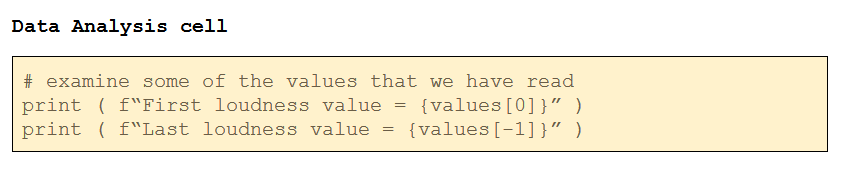
- In the Data Analysis cell, enter the following code underneath your graph plotting instructions and click on Run Selected Cell:
Data Analysis cell
# examine some of the values that we have read
print ( f“First loudness value = {values[0]}” )
print ( f“Last loudness value = {values[-1]}” )
- Compare the numbers displayed under your graphs with the height of the first (leftmost) and last (rightmost) sample points in the graph of raw loudness values.
List indices start counting from 0 so values[0] is the first sensor value that we read, values[1] is the second etc…
Starting from -1, negative numbered indices count back from the end of the list so that values[-1] is the last value that we read, values[-2] is the penultimate value etc…
Why not change the index numbers above to display some other values from the list or change the list name (values) to read some values from the smoothed_values or times lists?