Learn 4: Experiment With Color Sensing

This is the fifth challenge within the Robotics with GoPiGo and Python Curriculum.
Your task is to design a robot program to deliver a selection of mail to the residents of GoPiGo Drive, a small cul-de-sac containing 3 houses.
Learn how to how to use and calibrate the color sensor.
2. Realtime Data Analysis
Wouldn’t it be cool if we could put ourselves in the color sensor’s place and see what it sees in real time? Well, you can! Let’s show you how to do just that by using a really cool feature of Jupyter - a live auto-updating graph.
In the button panel under the Interactive Control Code cell there are buttons labelled Start Data analysis and Stop Data Analysis. These start and stop a graph update function that we’ve written for you.
- Position your robot on the printed color sensor calibration sheet with the color sensor directly above a colored square.
- Click on Start Data Analysis.
- Every few seconds pick the robot up, place it down on another colored square.
You will see a graph like the one below appear above the button panel. This displays the most recent values read for each of red, green, blue and clear. We have highlighted interesting regions of the graph below for you.
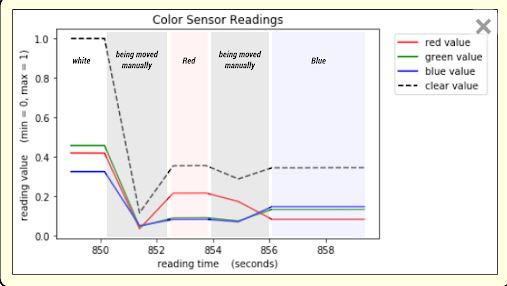
This graph automatically updates itself as new sensor readings are taken and stored in data list attributes in the variable container, with new values appearing on the right hand side as old values disappear off the left.
When dealing with large volumes of continually streaming data, it’s so much easier to monitor and interpret that data in real time this way than it would be by reading log messages being continuously printed in the notebook, isn’t it?
- Experiment with a range of different colors by coloring areas of white paper with pencils or colored markers and placing your robot’s sensor over these.
- How does each color relate to the mix of red, green, blue and clear sensor readings that you observe in the graph?
- How do the sensor readings compare?
When you have finished experimenting with color, click on the Stop Data Analysis button to halt the graph updates.