12 Mission Instructions
Your mission is to create a robotic seismograph that can travel to remote locations and measure tiny tremors. First, you will invent a way to simulate earthquakes so you can test your robot safely. Then you will design, test, and refine your robot until it is gathering the most useful data for you.
8. Data: What Are You Going To Do About It?
The program we’ve designed so far sets you up for a whole series of choices you can make. This robot is supposed to detect earthquakes and let you know. Here’s a great place to choose what exactly you want to know and how you want to be informed!
One option is to focus on designing a robot that alerts you when during an earthquake. Feel free to use any of your previous learning about lights, blinkers, wheels, or other actuators to make your robot come to life during an earthquake. Since we’ve introduced you to lots of actuators like lights and buzzers and wheels, if you want to do this option, we’ll leave you to invent your own robot responses!
The other option, however, is to collect the data and analyze it like a scientist. Since this is new information, we’ll keep going alongside you step-by-step.
The logging function is technically collecting the values from your shake table and saving them to your USB drive. The name of the file will be whatever you typed in the first orange block (our example is “log3”).
Try updating the name of your file (maybe to “log4”) and running your shake table for thirty seconds or so. Once you have included a few different sizes of earthquakes in between moments of non-earthquake stillness, turn off your GoPiGo and plug your USB drive into your computer.
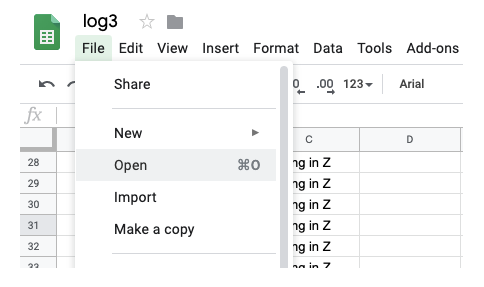
There are many programs that can open this file: the most commonly-known is Microsoft Excel, but if you don’t have that exact program, you can also use GoogleSheets which is a free web-based spreadsheet editor. Simply log into your account or create one, if you don’t already have one.
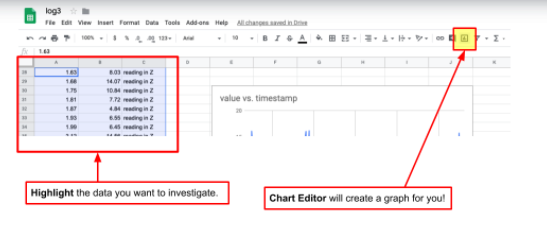
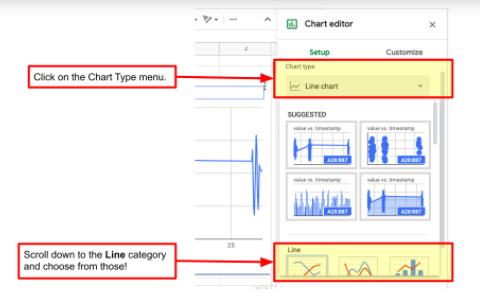
Then you can open the file (ours was called “log3.csv”) and start analyzing the data! One of the quickest ways to look for patterns is to have GoogleSheets graph your table for you. Simply highlight all the data cells and then click on the graphing button and choose line graph.