PA Designer Learn 3: Data Analysis

This is the second challenge within the Robotics with GoPiGo and Python Curriculum.
Your task is to program your robot to alert a person with a hearing impairment to visiting house guests.
Learn how to use the Loudness Sensor alongside Jupyter Notebooks.
3. Running Data Analysis
- Select the Main Code cell
- Click on Run Selected Cell
This re-initializes all the variables and collects 10 seconds of loudness data.
- Select the Data Analysis cell
- Click on Run Selected Cell again.
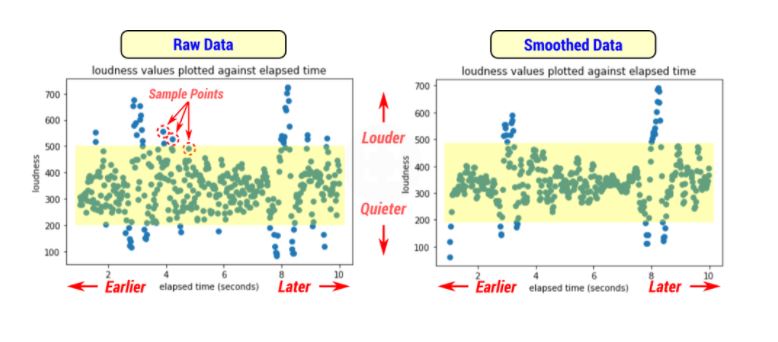
You should see two graphs like the ones displayed below. Each dot in these graphs is a point in time measurement of loudness. In the engineering world, we call these measurements sample points.
Most of the sample points in our example graphs have loudness values that lie within a horizontal band. This is the ambient noise of your environment. For a noise to be identifiable above ambient noise, it must generate loudness values higher than this.